Measuring Structural Order Parameters in Intra- and Interleaflet Lipid Clusters
I discuss use of hierarchical clustering to identify intra- and inter-leaflet clusters of lipids and analysis using MDAnalysis, scipy, and multiprocessing.
Lipid phase separation
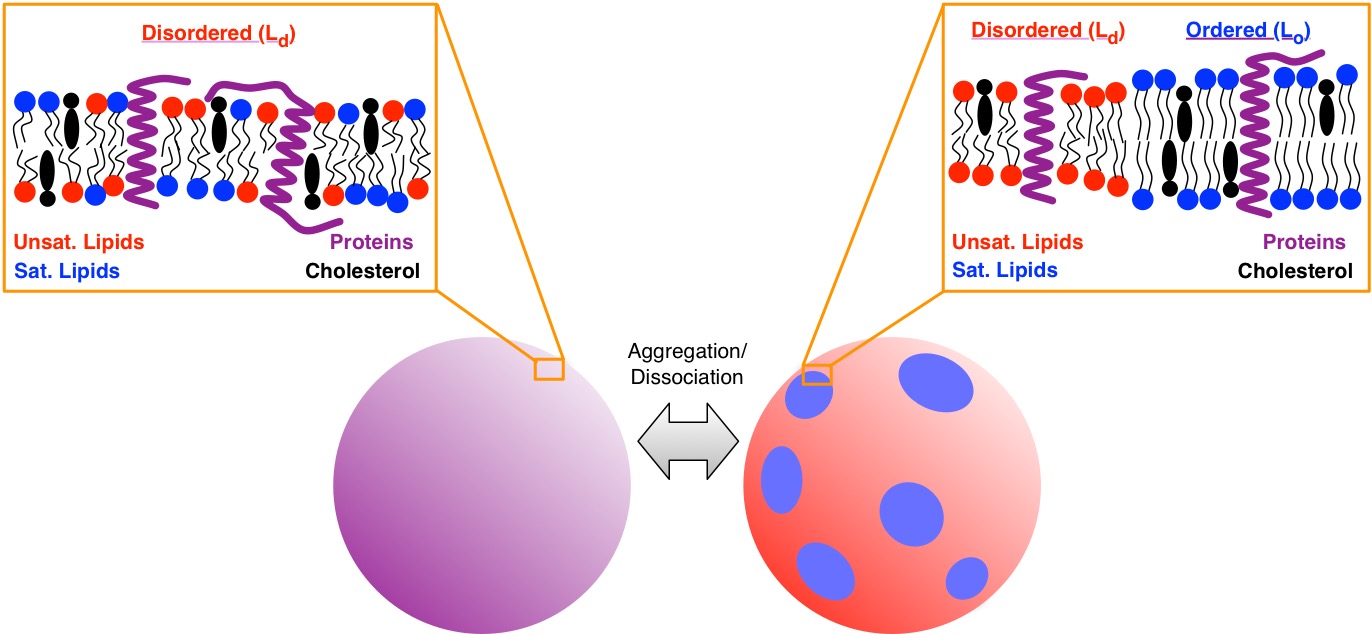
The phase separation of complex mixtures of lipids in cell membranes has been the subject of hundreds of investigations. This phase separation can cause for the formation of “domains” of lipids in different thermodynamic phases. Liquid ordered (Lo) and liquid disordered (Ld) phases have been the subject of many studies. A very simplified concept of phase separation is that, in a mixed state, all of the membrane exists in the Ld phase, but as high melting temperature lipids (e.g. saturated lipids, sphingomyelin) aggregate together with cholesterol, the Lo phase is formed.

Figure: Illustration of a macroscopic phase separation in a ternary lipid mixture with proteins.
Of course, proteins can adopt different folded structures depending on the thermodynamic phase they sit within, and understanding the true structure of the environment membrane proteins encounter is essential to the ultimate goal of understanding and manipulating the cell membrane.
Understanding the structure of lipid domains
Using molecular dynamics simulations we can understand the structure of lipids at any point in time. With such detailed information we can ask questions like “How does the structure of a lipid depend on the size of a domain?”
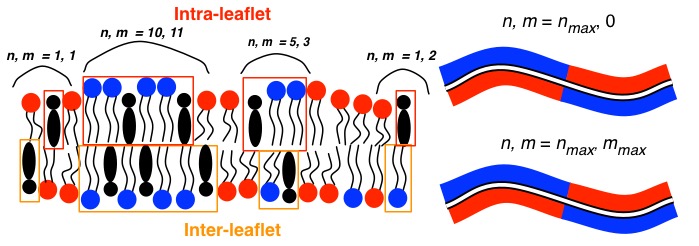
Of course we could answer this question as-is, but there is someting else very important to consider… lipid bilayers are a bilayer – the distribution of lipids is not perfectly symmetric across the two leaflets. So we should consider how many lipids are part of a domain in reference to each side of the membrane. This is to say, we should decompose the number of lipids involved in a domain into intra- and inter-leaflet lipids, and then measure the mean structural order for all lipids as dependent on the number of intra- (n) and inter- (m) leaflet lipids in the domain.
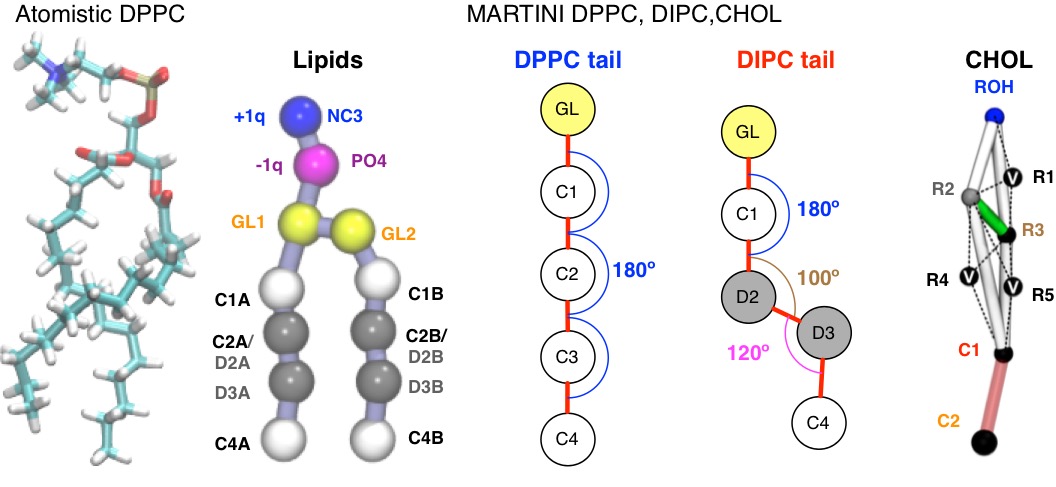
Currently, only coarse-grained models of lipid mixtures can reach an equilibrium spatial and structural distribution. I use the DPPC:DIPC:CHOL mixture in the MARTINI coarse-grained forcefield to study some general feature of phase separation. Many other people do, too.

Figure: (Left) Atomistic DPPC (130 atoms!) (Center) Schematic of MARTINI lipid bead names and restraints that cause for formation of different phases (12 atoms and ~10x larger integration time-step than atomistic!) (Right) CHOL model from Melo et. al. [1] is very rigid and uses virtual sites (v).
Clustering lipids
How do we cluster lipids to discover these domains? Most clutering algorithms require an input of k numbers of clusters to be assigned. In our case, we don’t know how many clusters exist in the membrane at any point of time. We can use hierarchical single-link distance-based clustering (HCA), because it’s easy to understand, easy to use, and makes no assumption of the number of clusters. Also, it’s in scipy.
Studies of lipid domain formation are typically initated from an ideally-mixed state where all lipids are in a Ld thermodynamic phase. The Lo thermodynamic phase forms as high melting temperature lipids (e.g. DPPC) and cholesterol (CHOL) aggregate. As such, I am only analyzing domains formed from DPPC and cholesterol. Additionally, DPPC and CHOL pack together most tightly about the lipid tails. Because DPPC has two lipid tails, I cluster each lipid tail individually.
I perform this clustering by
- Identifying all clusters of intra-leaflet lipids tails (C2A and C2B beads on DPPC, centroid of R[1-5] on CHOL) using HCA with a cutoff of 5.8 angstroms.
- For each intra-leaflet cluster, identify lipids in contact on the opposite leaflet by discovering lipid tails (C2A and C2B beads on DPPC, centroid of R[1-5] on CHOL) within a cutoff of 7.0 angstroms.

Figure (Left) Illustration of one state of a ternay lipid bilayer of DPPC (blue), DIPC (red) and CHOL (black) with clusters identified in reference to the top leaflet. (Right) Representation of the lipid bilayer configuration at maximum values of n and m.
On these clusters I analyze the liquid crystal order parameter \(P_2\) and the bond-orientational order parameter \(\Psi_6\). I discuss \(\Psi_6\) in another post. The mean order parameter of each cluster is evaluated, such that we have order parameters dependent on (n,m).
A script which implements all of these measurements is available on my github, which can easily be modified to perform this very same analysis with some other selected molecules. Feel free to message me if you’d like help to do this, but please read the comments first!
Please cite:
G.A. Pantelopulos, T. Nagai, A. Bandara, A. Panahi, & J.E. Straub “Critical size dependence of domain formation observed in coarse-grained simulations of bilayers composed of ternary lipid mixtures,” J. Chem. Phys. 147, 095101 (2017)
References:
- M.N. Melo, H.I. Ingolfsson, & S.J. Marrink “Parameters for Martini sterols and hopanoids based on a virtual-site description,” J. Chem. Phys. 143 243152 (2015).